Advertisement
If we don’t talk about these issues, it will be much harder to solve them. The first step is to have the courage to express our doubts.
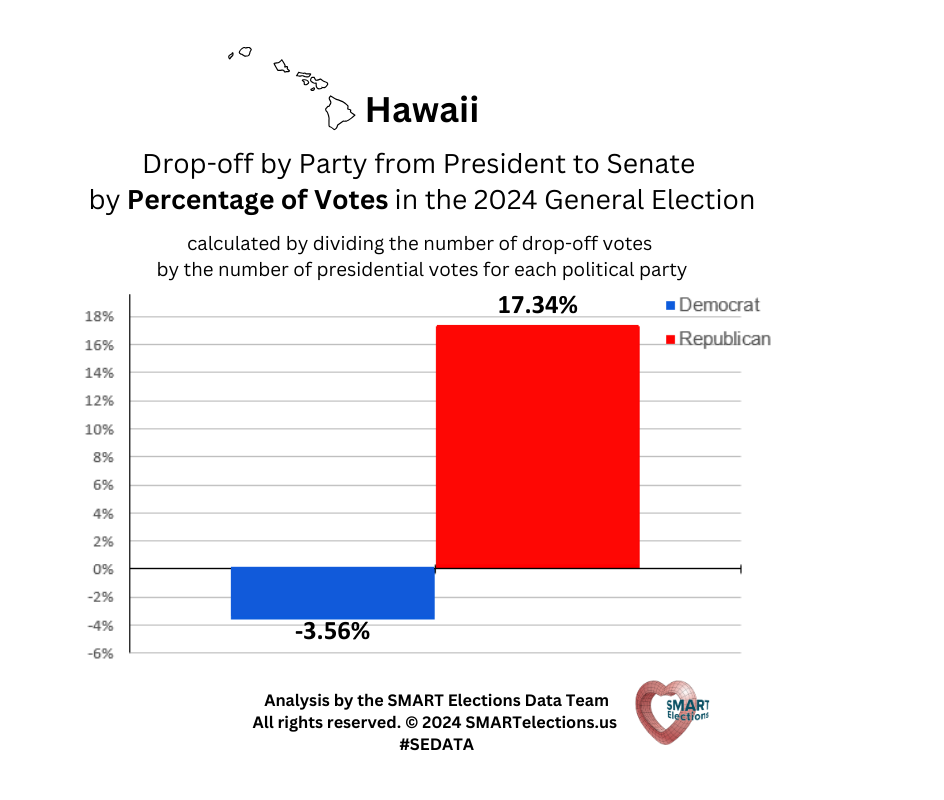
Drop-off By State & By CountyToday we also released the state drop-off bar charts showing the drop-off as measured by raw number of votes and percentages in each state. If you’re not familiar with the drop-off phenomenon, it’s worth taking 10 minutes and reading our previous post on this.
What is drop-off? We measure the difference between the votes for the President and the next down-ballot race, both in raw numbers and in percentages for each major party (Democrat and Republican). Why measure this? READ OUR PRESS RELEASE!
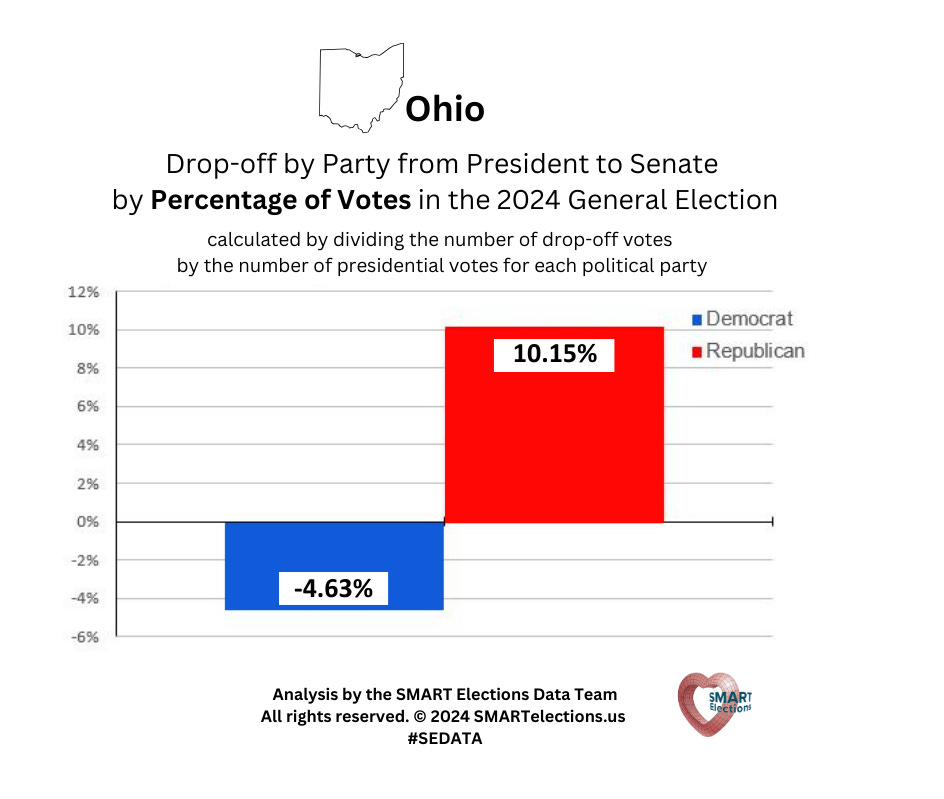
Ohio is notable, with a 10% Republican drop-off and the Democratic Presidential candidate in negative territory, getting 4.63% less votes than the Democratic Senate candidate.
If you’d like to see the county by county data for a particular state there is a link on our website, below each state bar chart. That takes you to the spreadsheet for that state.The spreadsheet shows you the drop-off by county for the entire state. The election results that the data refers to are in separate tabs on each spreadsheet.
Review the detailed Ohio drop-off analysis by county.
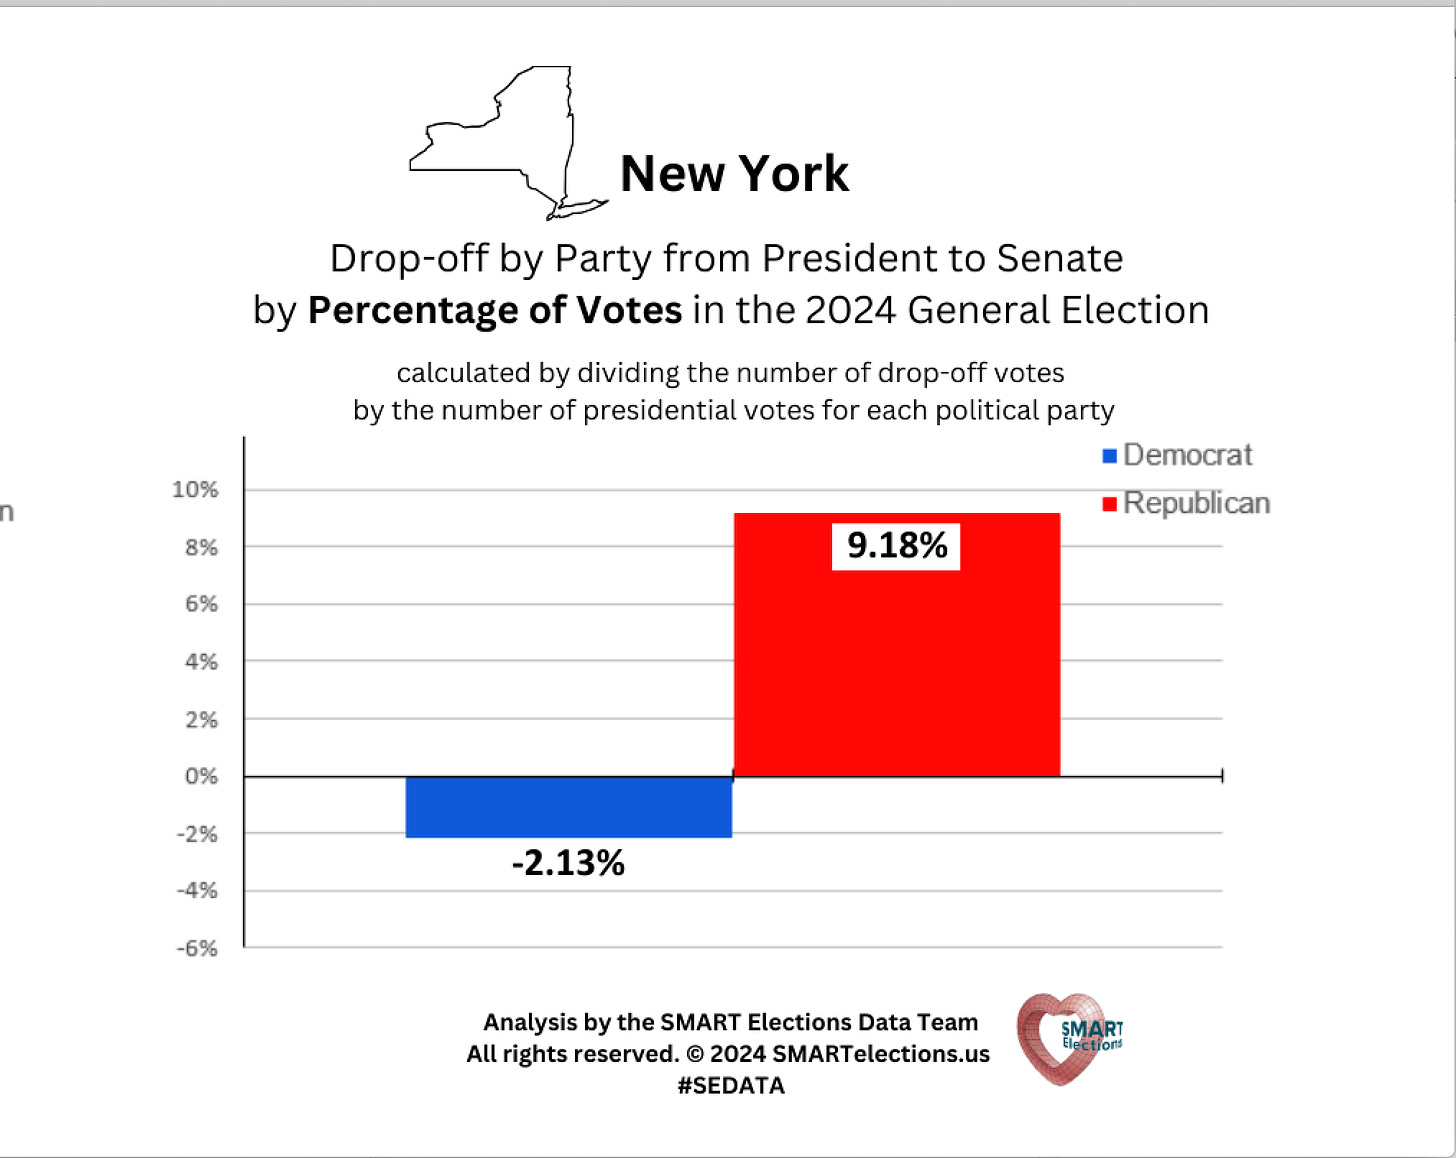
Review the detailed New York drop-off analysis by county.
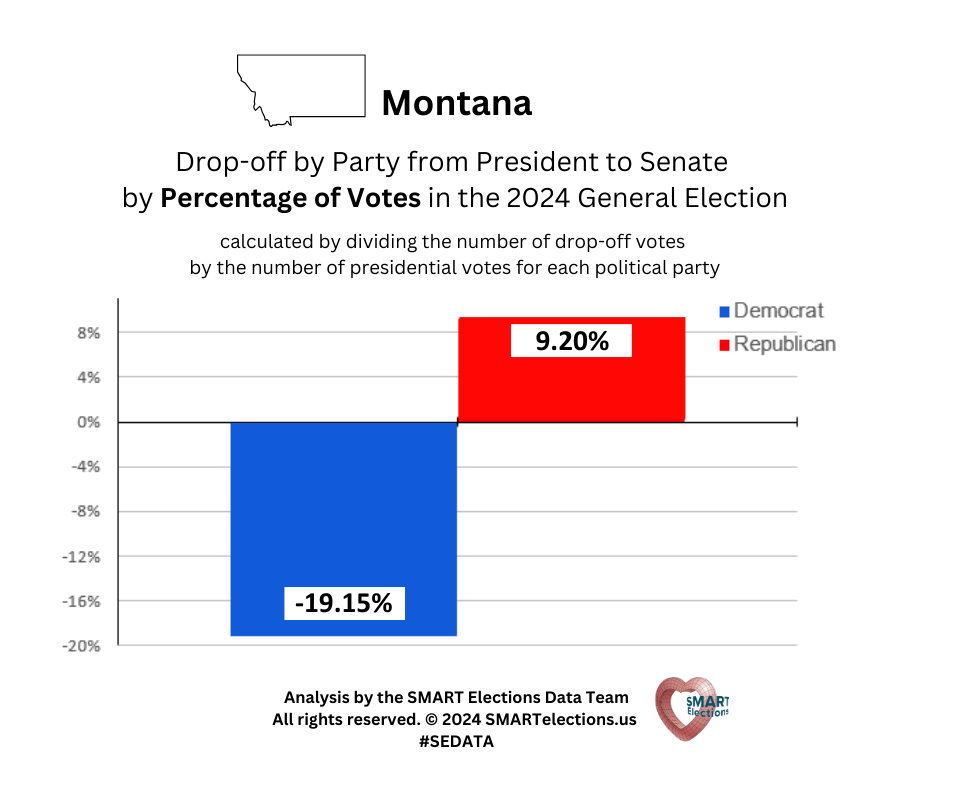
Review the detailed Montana drop-off analysis by county. Harris is almost 20% behind the Democratic Senate Candidate, Senator Tester, among Democratic voters.
Please link & credit when you share.
If you share our data, please link back to our work and credit the source.
Link either to our website, or the Substack post where you got the data:Source: SMARTelections.us
Source: SMART Elections Substack
Please credit our work by copying and pasting this text:Analysis by the SMART Elections Data Team. All rights reserved. ©2024 SMARTelections.us #SEDATA
That allows people to know the source of the data, have more confidence in it, and gives them the opportunity to get involved in improving our elections.
Here is the Full Press ReleaseDrop-off factor in Election Data Raises Questions About 2024 Election ResultsDecember 17, 2024 | Source: SMARTelections.us
New York, New York - - As electors in each state are voting for President and Vice President today, SMART Elections, a nonpartisan organization focused on security and public oversight of U.S. elections, is releasing a comprehensive analysis of the 2024 Presidential election phenomenon commonly referred to as “drop-off”. The detailed study includes six swing and eleven non-swing states and confirms what has been widely discussed on social media, Substacks, Reddit forums and among political advocates on both the left and right: in six of the seven swing states, and in all but four of the non-swing states they examined, there are considerably more votes for the Republican presidential candidate than for the next down-ballot race. The study calls this pattern “drop-off” and tracks the percentage of the drop-off and the number of votes involved, county by county, in all 17 states. The analysis for each state is available at SMARTelections.us
Drop-off: Democratic vs. RepublicanBy contrast, there is no large drop-off between the Democratic presidential candidate and the next down-ballot race. On the SMART Elections Substack, they post, “Instead, on the Democratic side, we find an opposite phenomenon. There are a large number of votes for the Democratic Senate candidate (or major down-ballot race) where there is no vote for the Democratic presidential candidate (Harris).”
Drop-off Leaves Democrats and Republicans Both Asking QuestionsIn a press conference on December 11th, House Minority Leader Hakeem Jeffries called attention to the strange drop-off phenomenon. He opened the press conference by saying, “The elections are over and the American people have spoken. Former President Trump will be the next President of the United States of America.” However, Jeffries ended his press conference on a different note, pointing out the odd contrast that in five of the seven swing states where election results show Donald Trump as the victor, the Senate races and sometimes the majority of down-ballot races were swept by Democrats. “What happened in the other five?” he demanded. (24:24) “In North Carolina,” he continued, “notwithstanding the fact that Donald Trump won at the presidential level, Democrats won the Governor’s race, the Lieutenant Governor’s race, the Attorney General race, the Secretary of State race, and the State Supreme Court, in North Carolina, on that very same day that Donald Trump won the presidential election.”
Republicans have also taken note of the drop-off figures, wondering conversely why the large Republican vote for president is somehow not reflected in their Senate and other down-ballot races.
Number of Votes Involved is Larger Than Margin of VictoryThe number of votes contained in these drop-off margins are startling. In five of the six swing states that are included in the analysis, the margin of drop-off votes is greater than the margin of victory.
Arizona
Drop-off margin = 267,956
Margin of victory = 187,382
Drop-off is 80,574 votes more than the margin of victory
Michigan
Drop-off margin = 99,109
Margin of victory = 80,103
Drop-off is 19,006 votes more than the margin of victory
Nevada
Drop-off margin = 70,067
Margin of victory = 46,008
Drop-off is 24,059 votes more than the margin of victory
North Carolina
Drop-off margin = 341,949
Margin of victory = 183,047
Drop-off is 158,902 votes more than the margin of victory
Wisconsin
Drop-off margin = 58,178
Margin of victory = 29,397
Drop-off is 28,781 votes more than the margin of victory
In order to accomplish the analysis, SMART Elections assembled a team of data scientists to gather and analyze 2024 election results. The team meticulously extracted and cross-checked election data. Each analysis was done independently by two separate data analysts. The results were then compared and confirmed to be identical before publishing. In most states the analysis compares presidential votes to Senate votes in the same party. When there is no Senate race, the Attorney General or Governor’s race was used in the comparison instead.
Different Demographics, Similar Drop-offThe most unusual aspect of the drop-off is its consistency. Statistical oddities are usually explained by specific demographic realities. Certain populations with their idiosyncratic voting behavior patterns create specific data sets that can be unique. However, with regard to the drop-off numbers, states with vastly different demographics are exhibiting the same patterns. Arizona and North Carolina would seem to be quite removed from each other demographically. However, Harris has 6% fewer votes than the next down-ballot race in both states.
Causes of the Drop-off Remains a MysteryWhat specifically is causing the drop-off is unclear. Possible explanations include:
Democratic Robert F. Kennedy Jr. supporters may have supported Trump in the presidential race due to Kennedy’s endorsement, but voted with the Democratic Party on down-ballot races.
Pro-Palestinian voters, especially young voters, may have chosen not to vote for president, or split their ticket.
Split-ticket voters may have chosen to cast a ballot for Trump while voting for down-ballot Democratic candidates.
New Republican voters were possibly excited for Trump and not other candidates.
Racial and gender bias against Vice President Harris may have contributed to her low numbers.
All of these may have been factors in the election results.
The numbers for some of these explanations do not pan out. For example, Robert F. Kennedy Jr.’s poll numbers in Nevada, according to FiveThirtyEight, had fallen to 5% by late August when he dropped out and endorsed Trump.
The SMART Elections Data Team has calculated the drop-off by political party, but it can easily be calculated for all voters as well. The Republican drop-off was approximately 5% of all presidential voters (1,484,840 votes) in Nevada. Kennedy withdrew from the ballot in Nevada and threw his support to Trump in late August. In theory, the 5% of Nevada drop-off (calculated from the number above of all presidential voters) could be a result of Kennedy voters supporting Trump and then voting Democratic in the down-ballot races. But it is highly implausible that Trump received 100% of Kennedy’s 5% support and that 100% of those voters then voted for a split ticket.
By comparison, a study by Yale, Harvard, Columbia and MIT scholars found split-ticket voting by Democrats in 2020 was 1%.
Furthermore, there was not a single state where Kennedy actually received 5% of the vote. In states where he remained on the ballot, he generally received less than 1% of the vote. Nationally he received 0.5%.
The number of young people voting in 2024 is also insufficient to solely account for the drop-off. Exit poll data from the National Election Pool found that voters ages 18 to 29 made up just 14% of all ballots in the 2024 election. According to the same exit polls, Trump had 46% support among those young voters. So Trump’s 46% of the 14% of young voters equals a 6.4% conservative voting block nationwide. Using Nevada again as an example, in this case, we’ll compare the percentage of these young conservative Trump voters to the 9.87% Republican drop-off in Nevada. Clearly, a 6.4% voting block cannot create a 9.87% drop-off effect.
If Harris’ negative support in some states is due to young people, angered by her position on Gaza, not voting for president; then why in Michigan, with its high Muslim population and active don’t vote for president campaign, is her drop-off still positive—even normal— (0.87%)? But in Montana, a state with a much smaller pro-Gaza movement (100 - 150 protestors at this rally), Harris’ drop-off rate is negative -19%.
Possibly, some combination of the various explanations have combined to create these drop-off numbers, but the consistency of the drop-off across a vast array of demographic landscapes remains surprising.
Error or Manipulation Cannot Be Ruled OutThe possibility that the drop-off is connected to some type of error or manipulation cannot be ruled out. There is no concrete evidence of foul play, and Vice President Harris chose not to request recounts, but public confidence would benefit from further scrutiny of the election results.
SMART Elections recommends that all states conduct a transparent, public review of voting machine source code, audit logs, ballots, voter sign-in files, and election records, such as poll tapes, to generate confidence in the election results. This type of robust investigation would go a long way to reassure voters, especially if the process was open and inclusive. Co-founder and Executive Director Lulu Friesdat says, “Voters don’t want to wonder if their votes are counted correctly. They want to know.”
There are a number of well-established vulnerabilities to the U.S. voting machines in this election.
The hard-wired password to Dominion’s voting machines was well known and even published on t-shirts. Dominion is one of the two major U.S. voting machine vendors.
On November 18th, @RedBear331 with the handle “Hacking Democracy” makes multiple claims of accessing voting machine totals:
“What did we do? Added, switched, & deleted votes with SQL. No logs. No trails. Democracy? More like democracy, unplugged.”
“🚨 SQL Democracy – Mission Accomplished 🚨Democracy Suite EMS relies on duct tape & a backdoor password: "dvscorp08!" .This hardcoded "security" + SQL commands = Trump's victory. We started in AZ, GA, PA... but didn’t stop there.Your democracy is a house of cards. 🐻”
“SQL database from a local EMS system (now Patriot County). Hardcoded backdoor password: "dvscorp08!", still live in systems across the country. Default Super Admin account Detailed exploit guide to replicate our methods. Screenshots of tampered registries”
A 2023 letter from top election security experts warned the Department of Justice that the majority of voting software used in the U.S. had been stolen and released on the internet. “The conspirators sought and obtained copies of voting system software from both Dominion Voting Systems and Election Systems & Software (ES&S), which together count over 70% of U.S. votes.” The experts convey urgency, even a sense of panic, saying, “democracy is literally on the ballot.” The letter was covered by PBS.
A more recent 2024 letter also to the Department of Justice by security advocates requests that “the Department of Justice (DOJ) initiate an investigation into the 2024 presidential election in light of reports of bomb threats, voter intimidation, voting system theft, documented "back doors" in that equipment that can be used to maliciously alter the results, and related concerns.”
Citing a Public Affairs Council study, Friesdat says, “Prior to the 2024 election, only 37% of Americans told researchers they believed the election would be both honest and open. The percentage of voters with complete confidence is likely even less now.”
SMART Elections is an innovative nonpartisan project. We advocate for improved election security and better public oversight. We want the public to have complete confidence in election results.
Media Contact:
Lulu Friesdat
Co-founder & Executive Director, SMART Elections
Please Support Our Work
A message from Co-founder & Executive Director, Lulu Friesdat: Your contributions will enable us to continue researching the 2024 election & build a nation-wide network of nonpartisan election protection volunteers.
Please donate today while you are thinking of it.
All donations are tax-deductible.


